|
|
Post by jamesinclair on Feb 15, 2011 0:33:47 GMT -8
I'd also be interested in lifetime silver line ridership. I noticed that BOTH planned "service/frequency upgrades" were canceled and never implemented, meaning the line still has abysmal headways during off peak hours.
There are two reasons ridership keeps going up:
People keep discovering the gold line extension, and using it to ride other lines
and
GAS
We're at $3.50 or so now. $3 may not have had the effect on people, but getting near $3.50...and staying above $3 certainly has.
|
|
|
|
Post by ieko on Feb 15, 2011 12:43:02 GMT -8
If the June service changes go as planned the Silver Line should get much better headways on the Harbor Transitway.
|
|
|
|
Post by LAofAnaheim on Feb 15, 2011 15:25:47 GMT -8
If the June service changes go as planned the Silver Line should get much better headways on the Harbor Transitway. Now that Metro re-adjusted the Silver Line to utilize the Harbor Transitway all the way to Adams (previously exited 37th), thus unable to connect to Expo Line at Trousdale station, will there be a bus stop near the 23rd street station? I wish Flower had a reverse bus only lane to work hand-in-hand with the Expo Line. Didn't Metro just increase Flower to 3 lanes for "increased traffic due to rail line"? |
|
|
|
Post by rubbertoe on Feb 15, 2011 16:50:21 GMT -8
I would be happy to track the Silver Line ridership, but as far as I can tell Metro doesn't break it out like it does the Orange Line numbers. I wouldn't put it in with the combined light rail data in this chart though. The Expo line will be here soon enough, and that will make this chart even busier. If anyone has access to or can point me to Silver Line data please do so. BTW, I added the gas price line to the above chart, though it may be too busy. I'll post it next month and let the board decide. I also set up the Expo Line chart so as to be ready when the trains start rolling. I thought that since the Expo Line had at one point been shown in black in some presentations, and had also been referred to as the Aqua Line, that I would make the fill color Aqua with a black border, and have the gas price line be black. I'm not terribly good with colors, so let me know what you all think, there is plenty of time to adjust the colors as required   |
|
|
|
Post by bluelineshawn on Feb 15, 2011 16:57:08 GMT -8
I'd say gas, I know it's the primary reason I've been using something like 90% transit lately. But gas didn't really rise until the last couple of weeks did it? We might see a little kick in Fed since gas has gone up maybe 7% in the last 2 weeks. Whatever the reason, I'm pleased to see the increase. |
|
|
|
Post by jamesinclair on Feb 15, 2011 18:25:43 GMT -8
Good call on the black border for the expo line, the aqua alone is too hard to see. bluelineshawn, gas prices have been on a steady march. Here's LA, 3 months 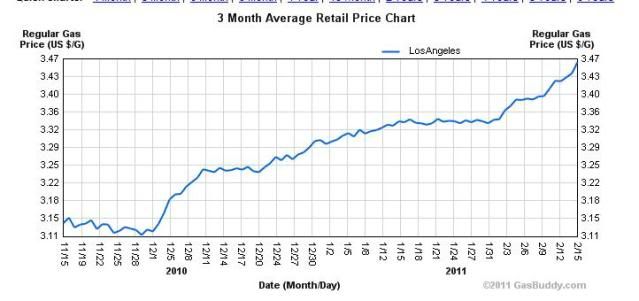 |
|
|
|
Post by ieko on Feb 15, 2011 19:44:20 GMT -8
I would be happy to track the Silver Line ridership, but as far as I can tell Metro doesn't break it out like it does the Orange Line numbers. I wouldn't put it in with the combined light rail data in this chart though. The Expo line will be here soon enough, and that will make this chart even busier. If anyone has access to or can point me to Silver Line data please do so. BTW, I added the gas price line to the above chart, though it may be too busy. I'll post it next month and let the board decide. I also set up the Expo Line chart so as to be ready when the trains start rolling. I thought that since the Expo Line had at one point been shown in black in some presentations, and had also been referred to as the Aqua Line, that I would make the fill color Aqua with a black border, and have the gas price line be black. I'm not terribly good with colors, so let me know what you all think, there is plenty of time to adjust the colors as required I'll see if I can get the data for the chart in the coming week or so. |
|
|
|
Post by matthewb on Feb 22, 2011 10:36:21 GMT -8
Here's a nice plot of average spot prices for oil over the past years:  Higher gas prices are coming for sure. With the current political unrest in North Africa and the Middle East, spot prices are above $105 www.bloomberg.com/energy/ |
|
|
|
Post by rubbertoe on Mar 1, 2011 7:08:06 GMT -8
I check the gas prices for the LA County average monthly on the 1st of the month. The increase for March over February was $0.38 from $3.35 to $3.73. Thats the largest increase I have except for $0.40 from May 2009 to June 2009. We could get to 400,000 combined riders including the Orange Line this summer.
RT
|
|
|
|
Post by jeisenbe on Mar 2, 2011 19:41:03 GMT -8
We could get to 400,000 combined riders including the Orange Line this summer. RT I expect >$4.00 this summer. I'm sure ridership will surge... if the economic recover can survive high oil prices. The US uses 20 million barrels of oil a day, 11.3 million imported. So whenever oil goes up by $10 a barrel, the USA spends an extra $113 million per day on importing oil, that could otherwise have been spent in this country. That is a huge problem for the economy. California uses 16 billion gallons of gas a year, so a $0.40 increase in gas prices takes over 6 billion dollars out of the state economy over one year. |
|
|
|
Post by LAofAnaheim on Mar 2, 2011 19:45:37 GMT -8
We could get to 400,000 combined riders including the Orange Line this summer. RT I expect >$4.00 this summer. I'm sure ridership will surge... if the economic recover can survive high oil prices. The US uses 20 million barrels of oil a day, 11.3 million imported. So whenever oil goes up by $10 a barrel, the USA spends an extra $113 million per day on importing oil, that could otherwise have been spent in this country. That is a huge problem for the economy. California uses 16 billion gallons of gas a year, so a $0.40 increase in gas prices takes over 6 billion dollars out of the state economy over one year. But yet people get upset if we subsidize Amtrak by $1.5 billion a year from the federal government..... |
|
|
|
Post by James Fujita on Mar 3, 2011 15:36:38 GMT -8
I know it's stupid, but the argument isn't all that clear-cut.
Every train in Amtrak is owned by the big, bad government, whereas most cars (with the exception of government employee vehicles) are owned by individual taxpayers. Sorry.
|
|
|
|
Post by rubbertoe on Mar 16, 2011 6:56:19 GMT -8
Ok, February numbers are out, and I will try the new eye chart picture. Also try providing a link to a larger picture for those who have trouble reading the smaller one that is 800 pixel wide limited: 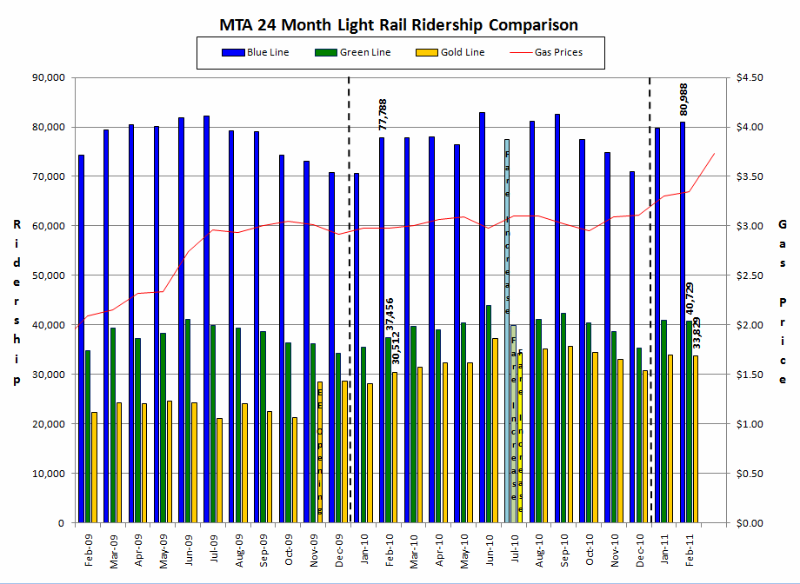 And the link to the larger picture: i882.photobucket.com/albums/ac27/RubberToe420/Combined02-11Large.jpgThe news for light rail ridership is all good. Gas on February 1st was $3.35, which is what you see in the graph, and note that the March 1st price will bump up to $3.73. Sure makes for a much more interesting graph  Now for the numbers, YOY increases and percentage increases: Blue: 3,200 4.11% Green: 3,273 8.74% Gold: 3,317 10.87% Combined: 9,790 6.72% The total light rail weekday ridership is 155,546. The EE specific increase numbers since opening plus 1 year now show: Nov-10: +4,643 Dec-10: +2,183 Jan-11: +5,720 Feb-11: +3,317 Looks like more people are finding their way onto the Gold Line over time, which we will keep monitoring. No lines are near their all time highs, but the summer peak may have something to say about that. It's unfortunate that the Phase 1 Expo line isn't going to be open this summer. It would have been good to get a summers worth of data for the new line. I guess we can keep our fingers crossed and hope that Metro is being very conservative and that the train testing goes smoothly. Interestingly enough, the Red Line was down 4,095 while the Orange Line was up 1,143. RT |
|
|
|
Post by jamesinclair on Mar 18, 2011 20:21:14 GMT -8
Fantastic graph, thanks for taking all the feedback into account. At least for me, it looks perfect.
Next month should be very interesting.
|
|
|
|
Post by rubbertoe on Apr 12, 2011 15:49:30 GMT -8
And here is the March data: 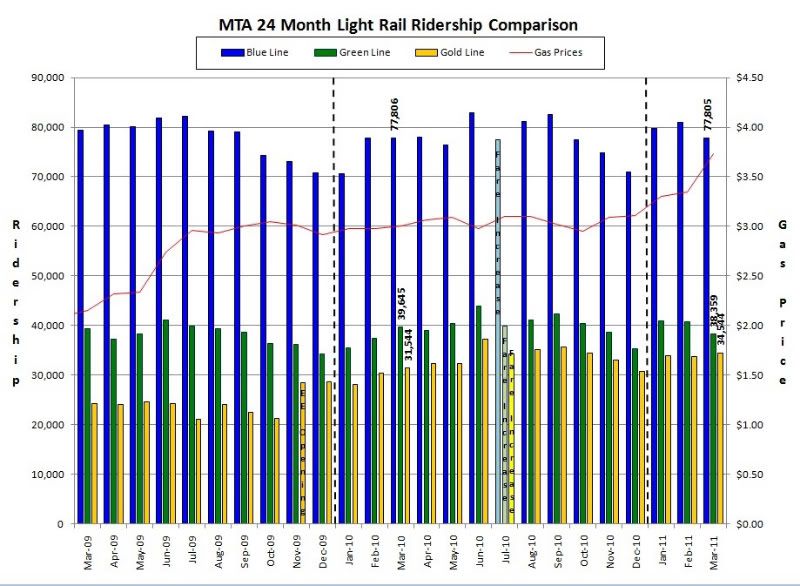 And the larger version: i882.photobucket.com/albums/ac27/RubberToe420/Combined03-11Large.jpgThe interesting thing is that even though gas prices are now going through the roof, light rail ridership has only increased a total of 1.15% in YOY terms, from 148,995 to 150,708. Maybe there will be a lagging effect, or maybe the pain threshold is the magic $4.00 per gallon level? Looking at the summer of 2008 spike, you could almost convince yourself that there was a lag from the price spike to the ridership spike. That can be seen in the individual ridership graphs for the lines. Surely it being summer helped out too, ridership always peaks then anyway. Other interesting thing is that the Gold Line is now less than 4,000 away from the Green Line. Given the still rising Gold Line numbers, I would expect it to pass the Green Line before the summer. And finally here are the Gold Line increases since the EE came online plus 1 year: Nov-10: +4,643 Dec-10: +2,183 Jan-11: +5,720 Feb-11: +3,317 Mar-11: +3,000 I'm guessing that this trend is what has led to the April introduction of 3 car trains to the Gold Line. On my way to work I have been noticing that they are starting to become the norm now. BTW, April 1 gas is $4.05, no fooling RT P.S. Red and Orange lines were up about 700 each. |
|
|
|
Post by bluelineshawn on Apr 12, 2011 16:26:12 GMT -8
Thanks rubbertoe. I'm a little surprised regarding the lack of a noticeable spike as well, although I haven't heard as many people complaining about the gas prices as in the in the past either.
|
|
|
|
Post by jamesinclair on Apr 14, 2011 17:25:59 GMT -8
Looks like the fare hike sitll has lingering effects on green and gold. That certainly influenced the effect gas prices had, as it alters the math for some counting their pennies.
|
|
|
|
Post by rubbertoe on May 16, 2011 13:44:20 GMT -8
The April numbers just went up this morning: 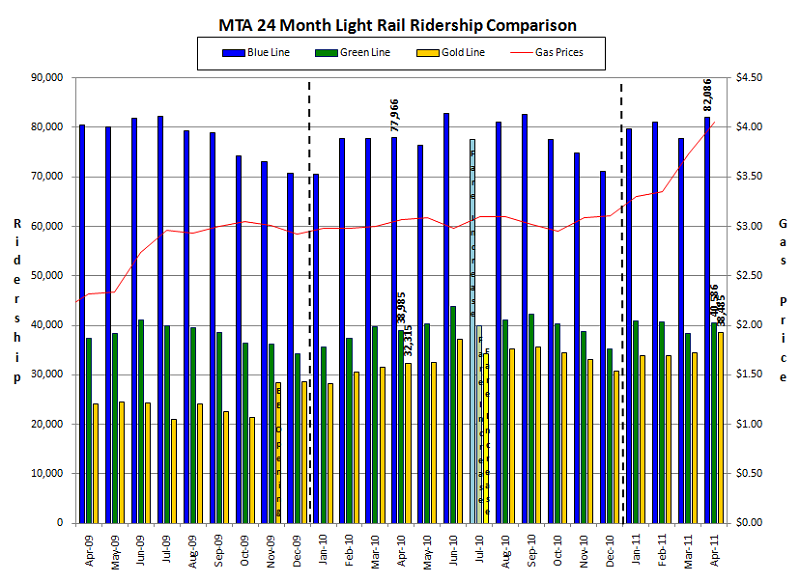 And the larger version: i882.photobucket.com/albums/ac27/RubberToe420/Combined04-11Large.jpgThe 3 car trains on the Gold Line appear to be translating into much better rider numbers. The Gold Line surpassed it's previous June 2010 record of 37,270 with an April high of 38,485. It is within 2,101 of the Green Line. The Mar-Apr numbers are historically a bit flat month over month, but this year saw improvement on all the lines. And the YOY numbers are up 11,894. So some combination of gas prices, improving employment, or the start of the baseball season has created a nice uptick The combined ridership of 161,157 is the second highest monthly total ever. Trailing the 164,014 posted in June 2010. And finally the Gold Line tracking: Nov-10: +4,643 Dec-10: +2,183 Jan-11: +5,720 Feb-11: +3,317 Mar-11: +3,000 Apr-11: +6,170 RT |
|
|
|
Post by bluelineshawn on May 16, 2011 19:25:33 GMT -8
Good to see. Maybe the first time in a while that all lines are up.
|
|
|
|
Post by bobdavis on May 18, 2011 17:33:37 GMT -8
Anyone know how many of the Gold Line trains have three cars now? I saw a three-car Siemens train Monday around 4 pm while going east on the 210.
|
|
|
|
Post by spokker on May 18, 2011 23:22:26 GMT -8
The Gold Line is known for its high cost per passenger mile to operate. I wonder how much cost the extra car adds and how much the cost per passenger mile is reduced by the extra passengers.
Surely there must be a net reduction in cost per passenger mile.
|
|
|
|
Post by rubbertoe on Jul 5, 2011 7:08:54 GMT -8
May numbers: 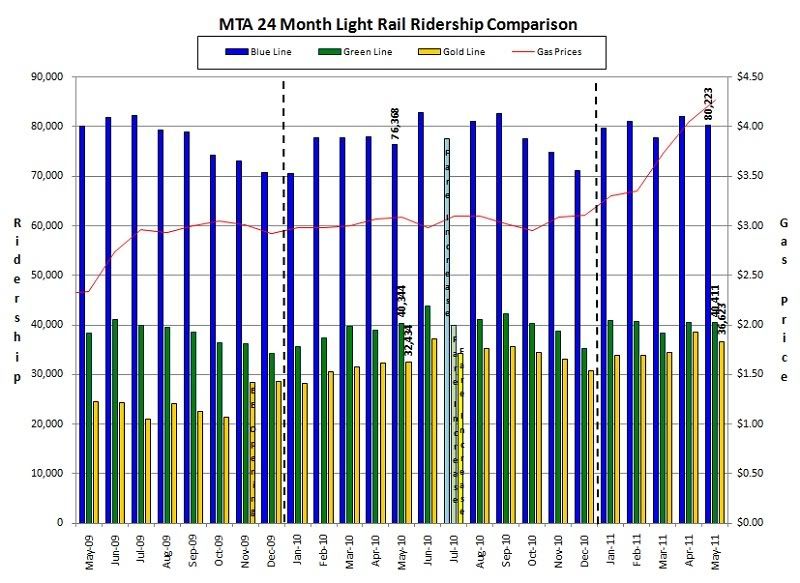 All lines showed MOM decreases from April, though the YOY numbers are still up: 157,257 in May 2011 versus 149,146 in May 2010. The Gold Line YOY increases continue to impress, there seems to be no stopping the trend. The GLEE is surely working for someone pretty big time. And this isn't even yet reflecting the recent (call it July) switch over to 6 minute rush hour headways. And the Gold Line tracking: Nov-10: +4,643 Dec-10: +2,183 Jan-11: +5,720 Feb-11: +3,317 Mar-11: +3,000 Apr-11: +6,170 May-11: +4,189, Average 4,174 FYI, Red Line down 4.80% YOY at 144,244 and the Orange Line is up 5.49% YOY at 25,485. |
|
|
|
Post by matthewb on Jul 5, 2011 9:19:10 GMT -8
1 thousand more and Metro will beat the Wikipedia numbers for San Francisco to be the 2nd highest ridership light rail system in the country.
|
|
|
|
Post by rubbertoe on Jul 5, 2011 9:37:03 GMT -8
We are ~60,000 away from Boston, which has the top spot. Maybe when Expo opens to Culver City we could get there? I'm not sure what the initial Expo predictions are, but if it trends like the GLEE, we are in good shape. SF is toast within a couple months RT |
|
|
|
Post by carter on Jul 5, 2011 10:46:31 GMT -8
We are ~60,000 away from Boston, which has the top spot. Maybe when Expo opens to Culver City we could get there? I'm not sure what the initial Expo predictions are, but if it trends like the GLEE, we are in good shape. SF is toast within a couple months RT The full Expo line to SM is expected to have about 64,000 boardings by 2030, IIRC. But that doesn't necessarily reflect new boardings on other lines for connections to Expo. |
|
|
|
Post by jamesinclair on Jul 5, 2011 22:53:40 GMT -8
We are ~60,000 away from Boston, which has the top spot. Maybe when Expo opens to Culver City we could get there? I'm not sure what the initial Expo predictions are, but if it trends like the GLEE, we are in good shape. SF is toast within a couple months RT Boston also has a light rail extension in the works, but its moving even slower than the LA projects. Should add a good 20,000 though. |
|
|
|
Post by masonite on Jul 6, 2011 11:01:40 GMT -8
We are ~60,000 away from Boston, which has the top spot. Maybe when Expo opens to Culver City we could get there? I'm not sure what the initial Expo predictions are, but if it trends like the GLEE, we are in good shape. SF is toast within a couple months RT Boston also has a light rail extension in the works, but its moving even slower than the LA projects. Should add a good 20,000 though. We were actually higher than San Francisco for 1 quarter and then fell back. What will also be interesting is when LA Metro Rail ridership in total passes BART. That is a ways off, but considering that popular opinion is that San Francisco has wonderful mass transit and Los Angeles has terrible mass transit, it would be interesting to see that play out and it has been fun over the years watching LA go up on the list on ridership. Of course, to be fair, one should really add the SF light rail totals to BART and then compare that against LA Metro Rail. That totals about 500k for SF and 300k for LA. We will need at least to the end of the decade to get close assuming SF only grows modestly (Expo, Foothill, Connector, Crenshaw, and first phase of the Purple Line to Fairfax or La Cienaga). What is a little depressing is comparing Commuter Rail ridership. Metrolink, despite a big system is way down the list and Chicago Metra often carries more people on some of their individual lines than Metrolink does on its entire system. I do think Metrolink has hit bottom though and we can expect to see better ridership in the future here. |
|
|
|
Post by LAofAnaheim on Jul 6, 2011 14:27:00 GMT -8
What is a little depressing is comparing Commuter Rail ridership. Metrolink, despite a big system is way down the list and Chicago Metra often carries more people on some of their individual lines than Metrolink does on its entire system. I do think Metrolink has hit bottom though and we can expect to see better ridership in the future here. Yes, our Metrolink system can do way better. However, I find the general thought of southland people are that all the stations should be surrounded by parking lots, which is killing its ridership potential. Imagine if there were office buildings and/or residential mid-rises surrounding stations. Then there would be more destinations along the Metrolink system. A parking lot is not a destination. Heck, it was proven in this study here about the LA Metro rail system, which can somewhat apply to Metrolink: straightouttasuburbia.blogspot.com/2011/06/la-metro-parking-and-ridership.htmlNot that "NO PARKING" is needed, but building a system for the sake of parking and with only LA Union Station being a true destination (Burbank rated # 2 as a destination, but is still so far low compared to the amount of people getting off/on at LAUS) |
|
|
|
Post by masonite on Jul 6, 2011 15:59:11 GMT -8
What is a little depressing is comparing Commuter Rail ridership. Metrolink, despite a big system is way down the list and Chicago Metra often carries more people on some of their individual lines than Metrolink does on its entire system. I do think Metrolink has hit bottom though and we can expect to see better ridership in the future here. Yes, our Metrolink system can do way better. However, I find the general thought of southland people are that all the stations should be surrounded by parking lots, which is killing its ridership potential. Imagine if there were office buildings and/or residential mid-rises surrounding stations. Then there would be more destinations along the Metrolink system. A parking lot is not a destination. Heck, it was proven in this study here about the LA Metro rail system, which can somewhat apply to Metrolink: straightouttasuburbia.blogspot.com/2011/06/la-metro-parking-and-ridership.htmlNot that "NO PARKING" is needed, but building a system for the sake of parking and with only LA Union Station being a true destination (Burbank rated # 2 as a destination, but is still so far low compared to the amount of people getting off/on at LAUS) I would agree with that to some degree. Metrolink doesn't have enough destination stations and Downtown Los Angeles, while being the largest employment center in the West, is not as large as say Downtown Chicago. In my opinion, the lack of connection and interface with the rest of the Metro system is also really holding back Metrolink. I've always been a big proponent of the Green Line Extension to Norwalk Metrolink and more recently the Red Line to Burbank Airport and its Metrolink station. These two connections would bring in much more Metrolink demand. Of course, old fashioned double tracking and other track improvements are really needed to bring increased frequency and faster times which would help a lot. Finally, even if the demand is there, a commitment from the member counties to fund more frequent service would be needed to realize the increased demand. I do think we are on the right track and will see better integration with the Metro system, with the Orange Line Extension, Expo (people on Metrolink often want to go farther west), the Purple Line, and even the Gold Line to Claremont. |
|
|
|
Post by matthewb on Jul 7, 2011 7:10:08 GMT -8
Maybe not the right thread, but Metrolink definitely can't just rely on riders going to Union Station if it's going to come into its own. While Union Station is and will probably always be the most compelling destination on the system, the network effect really comes into play when we have more of a web than a hub and spoke system. This already happens where the 91, IEOC, and OC lines provide connections in all directions. The one mile extension into downtown San Bernardino, connections to Redlands, and the addition of new stations in Riverside with the Perris Valley line will boost San Bernardino and Riverside as destinations for IE commuters and potentially increase the number of trains scheduled between those two cities. It's really a pity that NIMBYs killed the UC Riverside station for now. Let's hope it gets built within the next decade or two as an infill station. A Green line extension to Santa Fe Springs really makes sense once the Crenshaw line and LAX connection are built. Politically, it probably suffers from the fact that many of its riders would be coming from OC.
|
|


