|
|
Post by rubbertoe on Oct 12, 2011 16:49:25 GMT -8
September numbers are now out, so you all can sleep better at night  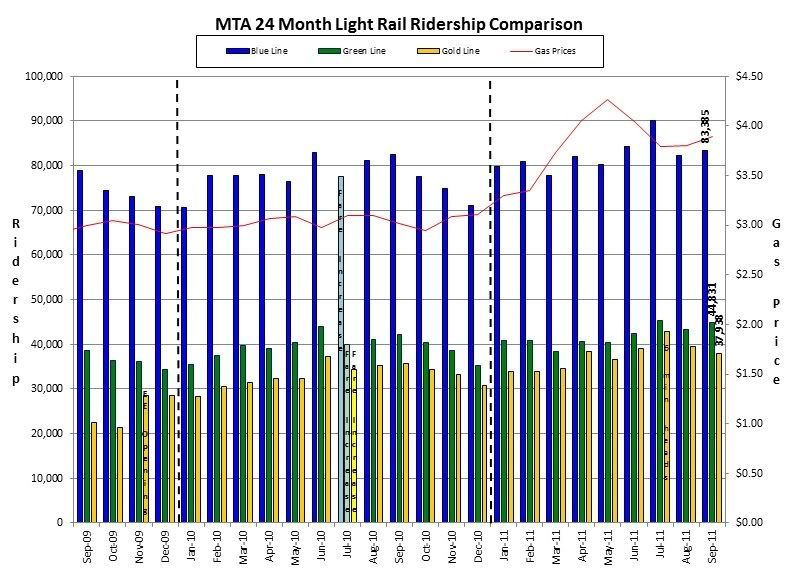 And the larger linked version: i882.photobucket.com/albums/ac27/RubberToe420/Combined09-11Large-1.jpgWe are off the July highs, but all three lines are YOY up. Blue up 1%, Green up 6%, and the Gold Line is up 6% too. The combined ridership is 166,154 which is up 3.55% YOY. We are now at 23 straight months of light rail YOY ridership increases. All good news, except that we are likely headed into the dreaded end of year ridership falloff. Astute watchers of the ridership graphs will be looking to see whether the December lows continue to see YOY increases. For example, here is the combined ridership for December (the annual low point), for the last several years: Jan-08: 121,175 Dec-08: 128,533 Dec-09: 133,662 Dec-10: 137,101 I think that while it is good that the summers have been seeing higher and higher all time ridership highs, we are also seeing higher and higher December low points. It means that more and more people over time are riding the trains, during all months of the year, not just in the summer. And the December riders are the "hard core" ones that probably ride all the time, so in a sense they are even more important than the seasonal riders. Here are the GLEE specific YOY numbers: Nov-10: +4,643 Dec-10: +2,183 Jan-11: +5,720 Feb-11: +3,317 Mar-11: +3,000 Apr-11: +6,170 May-11: +4,189 Jun-11: +1,842 Jul-11: +8,615 Aug-11: +4,351 Sep-11: +2,289 Other lines quarterly graph updates will be posted either later today or first thing tomorrow morning. Gas prices continue to hover just under $4.00 per gallon. RT |
|
|
|
Post by hooligan on Oct 18, 2011 23:12:03 GMT -8
The stat that still surprises me is the Green Line 45K weekday daily boardings! Still exceeds the Gold Line AND has a lack of walkable transit oriented areas. Do people value speed over walkability? in my case yes no other line gets you accross the LA Basin as fast. i used to commute from Pico rivera to Torrance the green line is what made the trip worth taking. It took 10 minutes from lakewood station to 110/105 station id then catch any southbound bus to Artesia transit and then Torrance Transit 6 to the front door of the Toyota Building.. Trip was always 1 hour. it competed with car travel on that same corridor as well i would make it to work in one hour 1:30 if i drove. Not everyone is going to beat their car commutes. I know it goes against what alot folks here want to see but id like to see more lines in the middle of freeways but with better station design and Security. |
|
|
|
Post by hooligan on Oct 20, 2011 17:08:44 GMT -8
The stat that still surprises me is the Green Line 45K weekday daily boardings! Still exceeds the Gold Line AND has a lack of walkable transit oriented areas. Do people value speed over walkability? in my case yes no other line gets you accross the LA Basin as fast. i used to commute from Pico rivera to Torrance the green line is what made the trip worth taking. It took 10/15 minutes from lakewood station to 110/105 station id then catch any southbound bus to Artesia transit and then Torrance Transit 6 to the front door of the Toyota Building. Trip was always 1 hour. it competed with car travel on that same corridor as well i would make it to work in one hour 1:30 if i drove. Not everyone is going to beat their car commutes. I know it goes against what alot folks here want to see but id like to see more lines in the middle of freeways but with better station design and Security. |
|
|
|
Post by rubbertoe on Nov 18, 2011 8:49:12 GMT -8
October chart is now here: 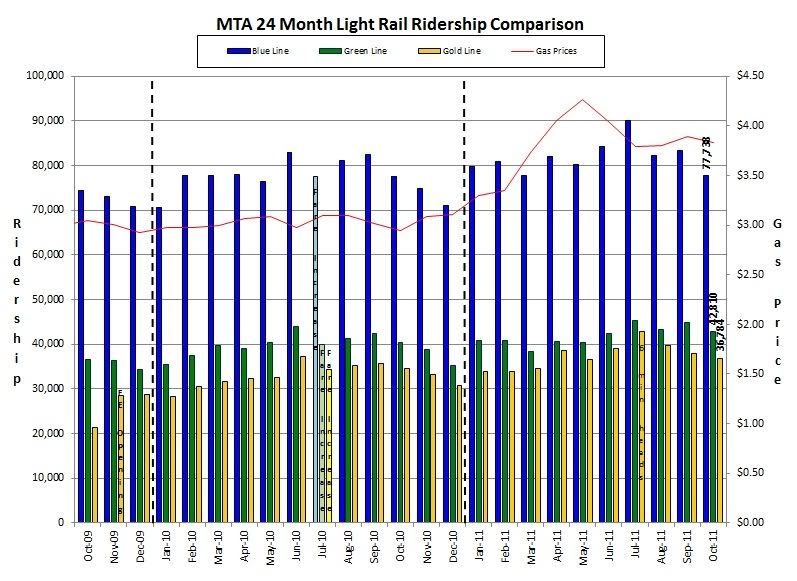 And the larger version: i882.photobucket.com/albums/ac27/RubberToe420/Combined10-11Large.jpgAll the lines are down MOM as expected. The YOY numbers for the Blue Line are about even, with the Green and Gold both up about 6%. Combined ridership is at 157,332 which is up 3.27% YOY. Gas prices remain elevated for this time of year now sitting at $3.83 versus $2.95 last October. I read somewhere that they were attributing that to the refiners producing more diesel fuel for export. With refined exports reaching an all time high, so less gasoline available for the US market. Here are the GLEE specific YOY numbers: Nov-10: +4,643 Dec-10: +2,183 Jan-11: +5,720 Feb-11: +3,317 Mar-11: +3,000 Apr-11: +6,170 May-11: +4,189 Jun-11: +1,842 Jul-11: +8,615 Aug-11: +4,351 Sep-11: +2,289 Oct-11: +2,344 We now stand at 24 consecutive months of light rail YOY ridership increases. Starting in December, I will add a notation to the Blue Line graph showing the new "10 min" late night service increase. Same for the Red Line. RT |
|
|
|
Post by bluelineshawn on Nov 18, 2011 11:34:56 GMT -8
Cool! Hopefully we continue to see year over year growth until Expo opens and then after that until phase 2 and then after that...
|
|
|
|
Post by rubbertoe on Dec 15, 2011 6:32:14 GMT -8
November numbers are out: 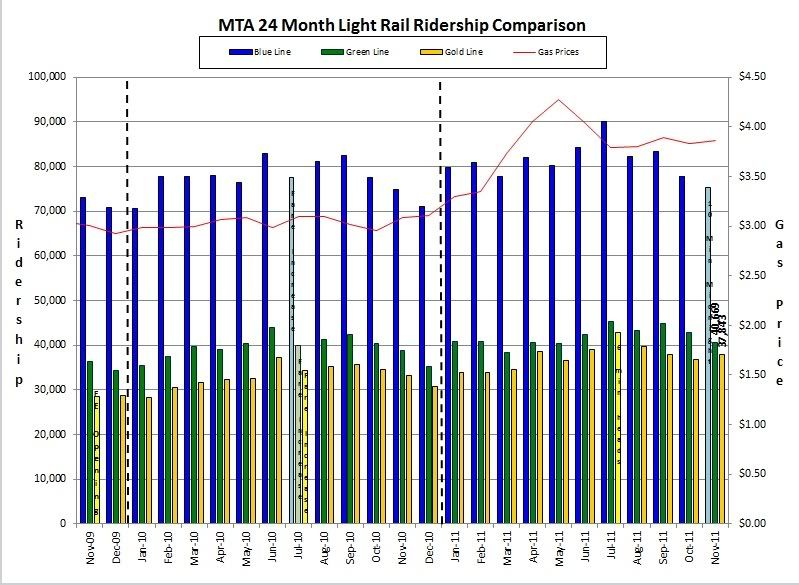 And the larger version: i882.photobucket.com/albums/ac27/RubberToe420/Combined11-11Large.jpgI show the "10 Min Midnight" label on the Blue Line November bar, though I suspect that the ridership numbers do not yet reflect the added service. Blue Line saw 75,250 versus a year ago 74,832, up 418. Overall, the numbers are very positive: Blue up 0.56%, Green up 5.07% and Gold up 14.26%. Overall light rail numbers are 153,762 versus year ago 146,659, or 4.84% higher. December ridership coming out next month should see the low point of the year. I think we should easily beat the 2010 level of 137,101. Here are the GLEE specific YOY numbers: Nov-10: +4,643 Dec-10: +2,183 Jan-11: +5,720 Feb-11: +3,317 Mar-11: +3,000 Apr-11: +6,170 May-11: +4,189 Jun-11: +1,842 Jul-11: +8,615 Aug-11: +4,351 Sep-11: +2,289 Oct-11: +2,344 Nov-11: +4,722 This continues to amaze. And also now at 25 consecutive months of YOY light rail ridership increases. RT |
|
|
|
Post by rubbertoe on Jan 12, 2012 16:57:48 GMT -8
December numbers just came out, and we have some long awaited developments: 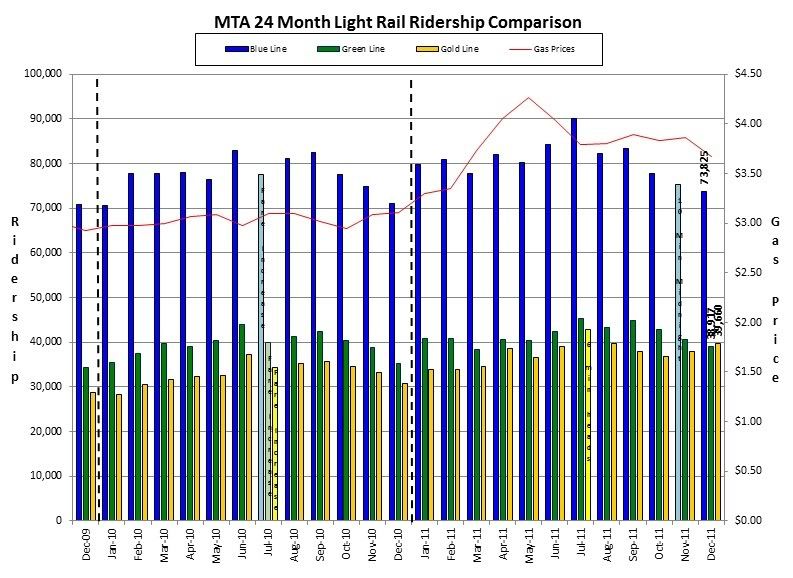 And the larger version: i882.photobucket.com/albums/ac27/RubberToe420/Combined12-11Large-1.jpgThe Gold Line just passed the Green Line in ridership!Looking at all the YOY increases now: Blue +2,787 or 3.92%, Green +3,658 or 10.37%, and the Gold +8,856 or 28.75%. Yikes  Combined we have 152,402 versus 137,101 last year, which is up 15,301 or 11.16%. Now at 26 consecutive months of YOY light rail ridership increases. Here are the GLEE specific YOY numbers: Nov-10: +4,643 Dec-10: +2,183 Jan-11: +5,720 Feb-11: +3,317 Mar-11: +3,000 Apr-11: +6,170 May-11: +4,189 Jun-11: +1,842 Jul-11: +8,615 Aug-11: +4,351 Sep-11: +2,289 Oct-11: +2,344 Nov-11: +4,722 Dec-11: +8,856 The December 2011 YOY increase of 8,856 riders over the previous year is the largest single increase since the GLEE opened. Looks like of you build it, they will ride. Time to fire up the TBM's for the Eastside Subway Extension project  December is always the month with the lowest ridership, and this year saw 152k versus 2010's 137k, and 2009's 133k. Maybe gas prices staying above $3.50 per gallon all winter has something to do with it. If that December number represents something that will continue going forward, then 2012 looks to be a banner year. RT P.S. The Red Line was up about 6%, while the Orange Line was down about 6%. Will post all the year end charts for the individual lines soon. |
|
|
|
Post by bobdavis on Jan 12, 2012 18:18:51 GMT -8
As a San Gabriel Valley native and Gold Line booster, I'm glad to see my faith rewarded.
|
|
|
|
Post by bluelineshawn on Jan 12, 2012 19:08:47 GMT -8
Excellent news! Thanks for summarizing rubbertoe.
|
|
|
|
Post by LAofAnaheim on Jan 12, 2012 21:44:53 GMT -8
Let's not forget.........December 2011 is when they introduced 10 minute headways on the Red, Purple and Blue Lines in the evenings 7 days a week. It gives users more reliability to the rail lines, thus increased ridership!
|
|
|
|
Post by matthewb on Jan 16, 2012 4:10:41 GMT -8
Let's not forget.........December 2011 is when they introduced 10 minute headways on the Red, Purple and Blue Lines in the evenings 7 days a week. It gives users more reliability to the rail lines, thus increased ridership! I guess that will show up more in January, but it's a pity that they provide the extra service in one of the months with typically lower ridership. It seems like the money spent would have a more noticeable impact if it were in a high ridership month that lead to record breaking ridership and perhaps a few newspaper articles. |
|
|
|
Post by LAofAnaheim on Jan 16, 2012 22:57:59 GMT -8
I guess that will show up more in January, but it's a pity that they provide the extra service in one of the months with typically lower ridership. It seems like the money spent would have a more noticeable impact if it were in a high ridership month that lead to record breaking ridership and perhaps a few newspaper articles. Hmmm......there were TONS of articles about this and December was prime because of the Holiday season. More people come out and about in the later hours due to 24 hour service nights and party season. If this started in January, people would be asking "why did this not happen in December when it was the Holiday season?". People will never be satisfied with a Metro decision..but it's better than nothing. |
|
|
|
Post by jamesinclair on Jan 17, 2012 1:36:34 GMT -8
Ill take advantage of the 10 minute headways this weekend. The implementation is weird though, the headways are LONGER earlier in the evening...
And yes, build it and they do indeed come.
I bet we'll be seeing record gas prices this summer, as this is the highest January gas price of all time. Look for record rail ridership to follow.
|
|
|
|
Post by matthewb on Jan 17, 2012 5:05:09 GMT -8
Ill take advantage of the 10 minute headways this weekend. The implementation is weird though, the headways are LONGER earlier in the evening... And yes, build it and they do indeed come. I bet we'll be seeing record gas prices this summer, as this is the highest January gas price of all time. Look for record rail ridership to follow. Hopefully they'll have funds to extend the more frequent headways into the summer months. Even better would be if they calculated that with increased ridership, more frequent headways drove down costs per rider. That might be enough to make them permanent, and to extend service improvements to other parts of the core system. Even though there's ample evidence from other parts of the world that improved service levels yield a disproportionate increase in ridership, with a phase transition where frequencies and speed outcompete other modes, it's still considered a risk for a resource constrainted transit agency to try it out. The results of this experiment will probably have a large impact on Metro decisions about service frequencies in the future. If it's not deemed a success, we probably won't see this level of service again for many years. |
|
|
|
Post by rubbertoe on Feb 16, 2012 6:24:08 GMT -8
January numbers are up: 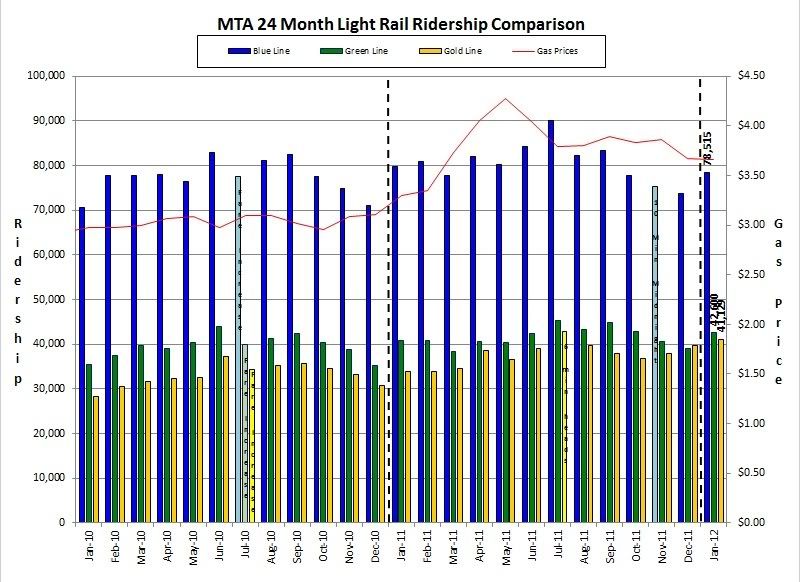 And the larger version: i882.photobucket.com/albums/ac27/RubberToe420/Combined01-12Large.jpgJanuary has shown that December was indeed the low point for the season. The Green Line and Blue Line both turned up from December, while the Gold Line started trending up back in November. The Gold Line was up 7,182 YOY, for a 21.16% increase, while the Green Line was up 1,709 YOY, for a 4.18% increase. The Blue Line was the only one down, -1,194 YOY, for a 1.5% decrease. All in all very good news again. Combined ridership was 162,244 which is up 7,697 YOY, or 4.98%, due almost solely to the Gold Line increase. Gas remained steady at the start of the month, at $3.66. The trend since that time has been increasing. This morning I saw $4.09 on the way in, so this summer looks to be possibly a record breaker. Now at 27 consecutive months of increasing light rail ridership. Here are the GLEE specific YOY numbers: Nov-10: +4,643 Dec-10: +2,183 Jan-11: +5,720 Feb-11: +3,317 Mar-11: +3,000 Apr-11: +6,170 May-11: +4,189 Jun-11: +1,842 Jul-11: +8,615 Aug-11: +4,351 Sep-11: +2,289 Oct-11: +2,344 Nov-11: +4,722 Dec-11: +8,856 Jan-12: +7,182 While the December 2011 pickup of 8,856 riders YOY was the highest ever, the 7,182 from this month is the 3rd highest from the list above. Whatever ridership plateau the Gold Line will eventually reach, we haven't risen to that level quite yet. RT P.S. The Red Line was at 144,854 up 1,220 while the Orange Line was at 23,050 up 1,934. |
|
|
|
Post by jamesinclair on Feb 16, 2012 21:59:11 GMT -8
Here are my predictions for this year's ridership highs, in July of course.
Red: 166,666
Blue: 101,111
Gold: 47,777
Green: 46,666
Orange: 27,777
|
|
|
|
Post by matthewb on Feb 17, 2012 9:59:21 GMT -8
Here are my predictions for this year's ridership highs, in July of course. Red: 166,666 Blue: 101,111 Gold: 47,777 Green: 46,666 Orange: 27,777 You forgot the Expo line. That would push your total over 400K. |
|
|
|
Post by jamesinclair on Feb 17, 2012 16:35:05 GMT -8
You forgot the Expo line. That would push your total over 400K. My prediction is for July, so no expo line.  In all seriousness, I have no idea what expo will do. July wont be the annual high for expo at all, because USC is going to be such a big draw. I predict october actually. |
|
|
|
Post by rubbertoe on Mar 14, 2012 6:16:43 GMT -8
February numbers are now up: 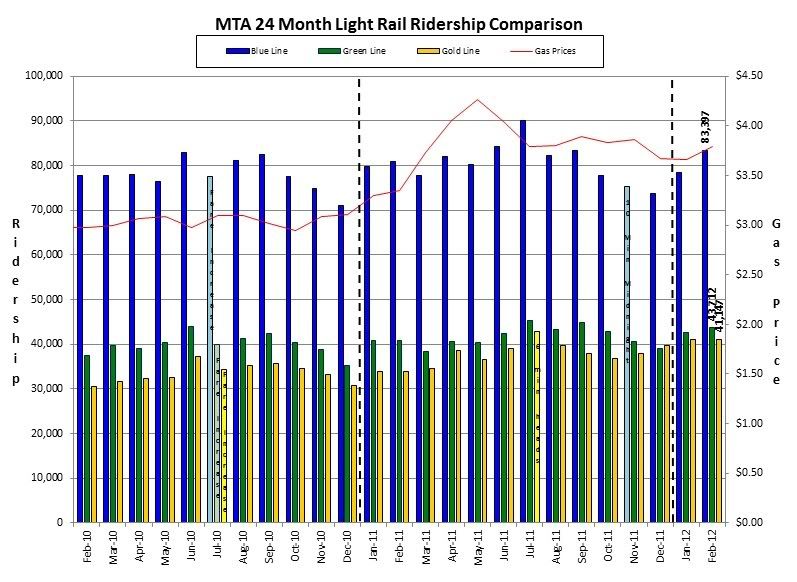 And the larger version: i882.photobucket.com/albums/ac27/RubberToe420/Cmbd02-12Large.jpgFebruary brings nothing but good news as the numbers are very strong, continuing the trend from January. Blue Line is up 2,409 YOY (2.97%) to 83,397. The Green Line is up 2,983 YOY (7.32%) to 43,712, and the Gold Line is still the star up 7,318 YOY (21.63%) to 41,147. The Green Line ticked up past the Gold Line in February. As the chart shows, the Blue and Green were also up substantially over the previous month, while the Gold Line was only up 18 riders from January. The month to month variations between the lines probably have more to do with regional differences (schools, businesses, summer destinations, etc.), while the YOY comparisons are more relevant to showing the general trends for the lines. Combined ridership looks like this: Up 12,710 YOY (8.17%) to 168,256. And 28 consecutive months of light rail ridership increases. Here are the GLEE specific YOY numbers: Nov-10: +4,643 Dec-10: +2,183 Jan-11: +5,720 Feb-11: +3,317 Mar-11: +3,000 Apr-11: +6,170 May-11: +4,189 Jun-11: +1,842 Jul-11: +8,615 Aug-11: +4,351 Sep-11: +2,289 Oct-11: +2,344 Nov-11: +4,722 Dec-11: +8,856 Jan-12: +7,182 Feb-12: +7,318 RT The Red and Orange were both up significantly: Red up 4,793 YOY (3.34%) to 148,180 and the Orange up 2,820 YOY (11.61%) to 27,104. That 27,104 is the second highest monthly total for the Orange Line ever. |
|
|
|
Post by bluelineshawn on Mar 14, 2012 17:46:34 GMT -8
Glad to see everything increasing again!
Rubbertoe, where are you getting your gas prices? Is that a local or national average because those prices for February look low. Maybe we started February that low, but we ended well over $4/gallon. I would think that the average for the month should be at least $4.
|
|
|
|
Post by rubbertoe on Mar 14, 2012 19:55:07 GMT -8
I check prices on the 1st of the month at losangelesgasprices.com. I just check the chart which updates in real time based on user inputs. And yes, prices shot up after the 1st.
RT
Sent from my DROID RAZR using ProBoards
|
|
|
|
Post by bluelineshawn on Mar 18, 2012 7:51:43 GMT -8
I check prices on the 1st of the month at losangelesgasprices.com. I just check the chart which updates in real time based on user inputs. And yes, prices shot up after the 1st. RT Sent from my DROID RAZR using ProBoards That number makes sense then, although it can be off somewhat if gas prices are rapidly increasing or decreasing throughout the month as we saw happen in February. |
|
|
|
Post by bluelineshawn on Mar 18, 2012 7:56:53 GMT -8
Here are my predictions for this year's ridership highs, in July of course. Red: 166,666 Blue: 101,111 Gold: 47,777 Green: 46,666 Orange: 27,777 I'd be surprised if the blue line went up that high anytime before the connector opens. And I don't really see Expo changing the ridership on other lines too much until it goes to Santa Monica, but it'll be interesting to see. |
|
|
|
Post by rubbertoe on Apr 13, 2012 5:58:02 GMT -8
March numbers: 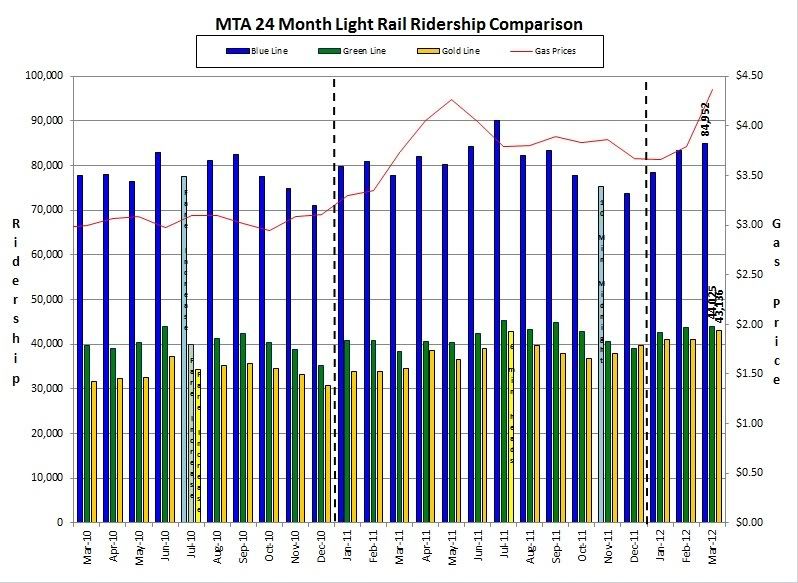 And the larger version: i882.photobucket.com/albums/ac27/RubberToe420/Combined03-12Large.jpgWell, the seemingly relentless stream of good news concerning ridership continues unabated, even accelerating as you will see... The Blue, Green and Gold Lines respectively showed a YOY increase of 9.19%, 14.77% and 24.87%. Blue was up 7,147 riders, Green was up 5,666 and the Gold was up 8,592. Total combined light rail ridership is now at 172,113 which is up 21,405 YOY and 14.20% YOY. The 21,405 increase is the second best in the last 42 months (as far back as my data goes), beaten only by July 2011, when the Blue Line and Gold Line both had all time high ridership. We are at 29 consecutive months of ridership increases on the light rail lines. The Gold Line at 43,136 is an all time high, surpassing the July 2011 ridership of 42,900. If you look at the 8,000 YOY improvement, and also at the July 2011 42,900 ridership, you could see a possibility that in July 2012 the Gold Line will carry 50,000 riders daily . I don't have the projections in front of me right now, someone else here might remember, but I don't believe that they were forecasting 50,000 daily riders until 2020 or possibly 2030. If anyone here has that data please post it. I will go out on a limb and predict 50,000+ riders in JUNE 2012.The gas price spike is now clearly evident in the March data, after being roughly stable from July 2011 to February 2012. The winter down trend never really materialized. As I write this the March $4.37 has slipped down to todays level of $4.22. Here are the GLEE specific YOY numbers: Nov-10: +4,643 Dec-10: +2,183 Jan-11: +5,720 Feb-11: +3,317 Mar-11: +3,000 Apr-11: +6,170 May-11: +4,189 Jun-11: +1,842 Jul-11: +8,615 Aug-11: +4,351 Sep-11: +2,289 Oct-11: +2,344 Nov-11: +4,722 Dec-11: +8,856 Jan-12: +7,182 Feb-12: +7,318 Mar-12: +8,592 RT P.S. Red and Orange were up 5% and 9% respectively, with the Orange Line getting close to it's all time high. |
|
|
|
Post by rubbertoe on Apr 13, 2012 6:14:34 GMT -8
In getting ready for the Expo Line, I wanted to see if anyone had any input concerning the formats and such. If anyone is interested or has any suggestions please let me know. The Expo color is RGB (0, 169, 224) as previously mentioned here. The small chart gets nearly unreadable when you add another column of data, so I was thinking about just having it show the last 13 months of data, and not including the gas prices. Expo Line has pseudo data included to show what a filled in graph will look like. Something like this: 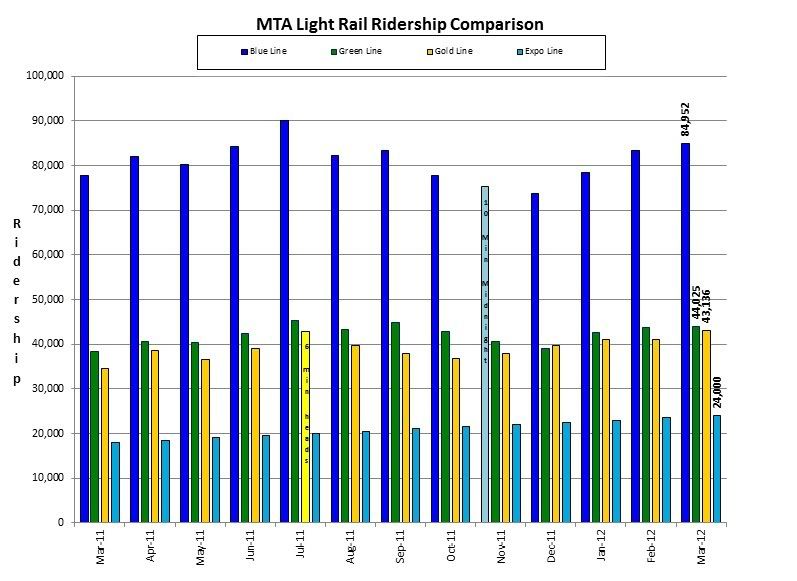 And the for the larger picture that gets linked to, having the full 2 year (25 month) trend, like this: i882.photobucket.com/albums/ac27/RubberToe420/ExpoTestLarge.jpgRT |
|
|
|
Post by matthewb on Apr 13, 2012 8:45:50 GMT -8
In getting ready for the Expo Line, I wanted to see if anyone had any input concerning the formats and such. If anyone is interested or has any suggestions please let me know. The Expo color is RGB (0, 169, 224) as previously mentioned here. The small chart gets nearly unreadable when you add another column of data, so I was thinking about just having it show the last 13 months of data, and not including the gas prices. Thanks for putting the ridership numbers in easy to read format. One thing that could potentially be of interest is to have an even longer view of things, say 5 years. Since the individual lines would be difficult to visualize, would it be possible to just sum all the lines (blue, green, gold, expo) into one total light rail ridership column? This would tell an amazing story about how people get around LA is changing. This of course in addition to the data broken down by line over a shorter time frame (e.g. 2 years like you proposed). What do you think? |
|
|
|
Post by rubbertoe on Apr 13, 2012 8:56:36 GMT -8
Great idea! And it will certainly tell an amazing story. Maybe every quarter I will also show this new chart. I will try and pull this together this weekend, so it will start with Q1 2012. The data is all there obviously, I just need to add a new chart.
RT
|
|
|
|
Post by bluelineshawn on Apr 13, 2012 17:02:48 GMT -8
Rubbertoe, thanks for keeping up with this. Your efforts are appreciated. |
|
|
|
Post by rubbertoe on Apr 13, 2012 18:18:00 GMT -8
Ok, In the 11-2-01 FEIR, here is the section on the expected ridership on the EE extension. It isn't clear whether the EE itself is producing the 25,000 to 28,000 per day numbers quoted, because Metro doesn't break down the EE ridership separately. But, the number in the estimate below that really stands out is the 45,000 by 2020. We are now at 43,136, and should beat the 45,000 next month, about 8 years early. Kind of makes you wonder if anyone ever goes back and looks at things like this to figure out what went wrong in their estimating, so that they can get it right the next time around. And not keep making the same mistake over and over  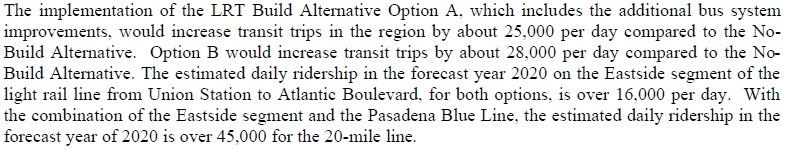 |
|
|
|
Post by jamesinclair on Apr 13, 2012 22:49:43 GMT -8
In getting ready for the Expo Line, I wanted to see if anyone had any input concerning the formats and such. If anyone is interested or has any suggestions please let me know. The Expo color is RGB (0, 169, 224) as previously mentioned here. The small chart gets nearly unreadable when you add another column of data, so I was thinking about just having it show the last 13 months of data, and not including the gas prices. Expo Line has pseudo data included to show what a filled in graph will look like. Something like this: RT Looks good. I would do 14 months and add the dotted line just showing where 12 months is. Heres how I do it with amtrak, which was inspired by this thread. Shouldn't look too bad with the 4th line. 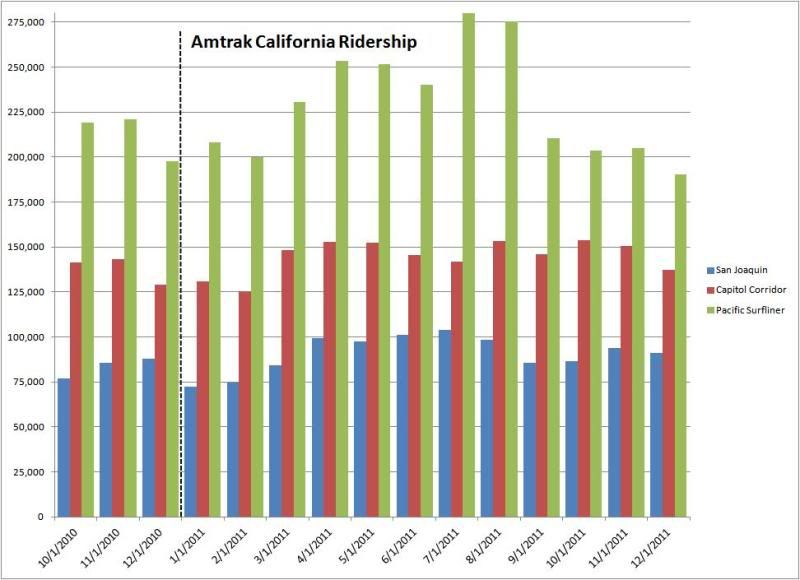 |
|


