|
|
Post by rubbertoe on Jul 10, 2009 8:24:33 GMT -8
Hi All, First post here. Have to say that after discovering this site I really like all the pictures that people post of the ongoing construction. Very good discussions of the merits of trams versus light rail versus other alternatives too. I live in Pasadena, and though I don't have any pictures to share, I have been following MTA ridership for quite awhile. Thought I would share a graph showing the Gold Line ridership for the last 5 years. I'm looking forward to seeing how the opening of the Eastside extension adds to the totals. I will use this thread going forward to keep posting monthly graphs of the ridership. One thing that I had thought about adding was another line showing the gas price in LA County, superimposed over the ridership chart bars. That would be an easy way to correlate how higher gas prices lead to better ridership numbers. The spike in June 2008 over 25,000 being the clearest example of that. If anyone has a link to LA County gas prices and would share it I will try and incorporate that in. I have charts for the other lines too, and may start up threads in the other lines forums. The opening of the extension should have a pretty visible effect on the Red Line too. RubberToe  |
|
|
|
Post by Jason Saunders on Jul 10, 2009 11:17:22 GMT -8
Welcome RT, A graph really puts the ridership into perspective. For example, even without a gas price comparision, I can clearly see that every summer ridership increases and then dips down again in the fall. This corresponds to the summer driving season where gasoline becomes more expensive and when the more expensive 'California mix' of gasoline is distributed. Even though ridership dips after the summer driving season it looks like some of those riders stay on even after gas prices fall for an overall upward trend. I wonder what effect the Eastside Ext. will have on ridership as well. Anyone know what projections are? |
|
|
|
Post by joshuanickel on Jul 10, 2009 12:03:28 GMT -8
I heard 13,000 after the first year.
|
|
|
|
Post by kenalpern on Jul 10, 2009 16:10:59 GMT -8
Sadly, the nonexistence of the Downtown Connector will limit the full potential of this Eastside Extension. Still, we might see a surprise bump because while I do NOT see floods of Eastsiders going to the Pasadena end of the world, I really DO see floods of Eastsiders wanting access to the Red Line and Purple Line Subways.
|
|
|
|
Post by spokker on Jul 11, 2009 20:29:32 GMT -8
The purpose is this thing isn't to get Eastsiders to Pasadena. It'll be faster to take a rapid bus depending on the station. I was always under the assumption that it was to connect East LA to Downtown.
|
|
|
|
Post by James Fujita on Jul 12, 2009 9:33:21 GMT -8
one would hope that there would be some riders from the Pasadena direction heading east to visit the new stations as well... after all, the Eastside extension does add Little Tokyo and Mariachi Plaza as possible "places to go" on the Metro Rail map...
something just occurred to me... what sort of ridership counting will the MTA be doing for the extension? since it's all part of the Gold Line, would the MTA count a trip from Chinatown to Little Tokyo as just a Gold Line trip? or as Pasadena and Eastside trips?
|
|
|
|
Post by LAofAnaheim on Jul 12, 2009 10:47:26 GMT -8
something just occurred to me... what sort of ridership counting will the MTA be doing for the extension? since it's all part of the Gold Line, would the MTA count a trip from Chinatown to Little Tokyo as just a Gold Line trip? or as Pasadena and Eastside trips? I'm pretty darn sure in terms of ridership statistics..any trip on the new Gold Line will be counted as Gold Line and not split between LAUS - Pasadena and LAUS - Atlantic. As you stated earlier..there will be interest of people coming from Lincoln Heights, Chinatown, Pasadena to Mariachi Plaza and Little Tokyo. You'll see a significant jump in ridership numbers once the Eastside extension opens up. It's not like the MTA kept different riderships when the Red Line opened at Wilshire/Western, then Hollywood/Highland, and then North Hollywood. It's all one line. |
|
|
|
Post by rubbertoe on Jul 18, 2009 17:24:28 GMT -8
Ok, The June ridership numbers have been released. I have updated the graph to include them. I also dug up the LA County monthly gas prices from the EIA database, and have added a line for them, in addition to the columns that show the ridership. When I first saw the plot it was actually scary. The correlation between gas prices and ridership is so close that I thought at first I had made a mistake. Went back and checked the numbers and it is definitely for real. I didn't doubt that they correlated pretty well, I just didn't think they would fall right on top of each other like they do for a good part of the graph. The part where they do deviate starts around October of 2008. When gas prices came down below $3.50 per gallon, the Gold Line ridership maintained the 22,000+ level, and has ever since. I had heard talk along the lines of... "While transit ridership goes up as gas prices rise, it comes back down when gas prices fall". But what happened after the big gas jump in the summer of 2008 seems to be more like some people switched permanently to the Gold Line. Maybe the shock of $4.00 gas led to the current situation. It bodes well for the future if the trend holds. RubberToe  |
|
|
|
Post by Jason Saunders on Jul 18, 2009 20:17:06 GMT -8
Thanks RT, Seems like a ton of work and very informative. I found it interesting that in April 05 the uptake in ridership preceded the gas price increase. I wonder what sparked this. Anticipation of a price hike or did some other thing happen in the world? Perhaps a very good ad campaign? |
|
|
|
Post by crzwdjk on Jul 22, 2009 20:13:42 GMT -8
When did the speedup happen? At some point they first introduced express trains, then cut five minutes from the schedule. That led to a noticeable (anecdotally) increase in ridership. Before that people were complaining about how slow the line was, when the trains crawled into each station at 10 mph.
|
|
|
|
Post by bobdavis on Jul 23, 2009 16:44:22 GMT -8
I'd have to get out my old Gold Line timetables, but about two years ago is my guess. When I came back from the Metro meeting today, we rolled right through the slow section in Highland Park, without stopping. I think in the last two or three years, the signal and car-control systems have been adjusted to speed up service. Cars no longer "sneak up" on stations; they're still not like New York subway trains, but they do come in more "assertively".
|
|
|
|
Post by rubbertoe on Jul 27, 2009 14:55:24 GMT -8
I'd have to get out my old Gold Line timetables... Bob, If you or anyone else happens to come across a timetable that shows when the trains started running faster along the route I would be happy to add that to the graph. Up until I read your post I hadn't considered that possibility in regard to faster trains leading to more riders. I guess I must have assumed that once the trains started running, that they would have the same timetable going forward that they did when they first started. I do remember the "express train" experiment from a few years back, which was eventually discontinued. March of 2008 kind of stands out as a possibility... RubberToe |
|
|
|
Post by rubbertoe on Jul 27, 2009 15:13:01 GMT -8
Well,
Search is definitely your friend, or my friend in this case. Searching the metro web site shows that starting on 10-29-06 the travel time was reduced from 34 to 29 minutes. They also implemented 10 minute rush hour headways during that period.
Then, on 12-16-07 they eliminated the express service test, and further reduced the rush hour headways to the current 7-8 minutes. I'll add those to the graph next time I post the July numbers. Adding more trains during rush hour probably also boosts ridership, as people end up waiting a shorter time for the train to arrive, and that is combined with the faster trip too.
RubberToe
|
|
|
|
Post by rubbertoe on Aug 13, 2009 15:04:28 GMT -8
July 2009 numbers are up. Gold Line numbers are pretty disappointing, which is pretty strange because the Red Line was up about 6,000, the Blue Line up slightly, and the Green Line down about 1,200. I have added the labels for the 10 minute headways and 29 minute travel time in 11-06, and the even shorter headways in 01-08. In both of those cases, ridership seemed to track gas prices instead of the quicker trip times. RubberToe  |
|
|
|
Post by metrocenter on Aug 14, 2009 8:01:53 GMT -8
Traffic has been way down in the summer. When the Pasadena Freeway is moving, it easily beats the train in terms of speed. The same can be said about the Green Line and the Century Freeway. This could partially explain the ridership drop on these lines during July.
|
|
|
|
Post by rubbertoe on Oct 1, 2009 17:02:54 GMT -8
August numbers are finally up, not sure what took them so long. The low number from July seems to have been an anomaly, since the August number of 24,175 seems to be back in-line with the 4 months prior to July. Gas prices are steady, remaining parked just below the $3.00 level. We are only a few months away (mid-December hopefully) from having the first Eastside Extension data added in.  |
|
|
|
Post by rubbertoe on Nov 9, 2009 10:10:59 GMT -8
I was able to grab the September numbers before the MTA website was apparently destroyed, never to return. Nothing Earth shattering. Back down to the 22,000 level, and gas was at an even $3.00 on September 1st. They didn't post the numbers until I wrote an e-mail and requested them. RT 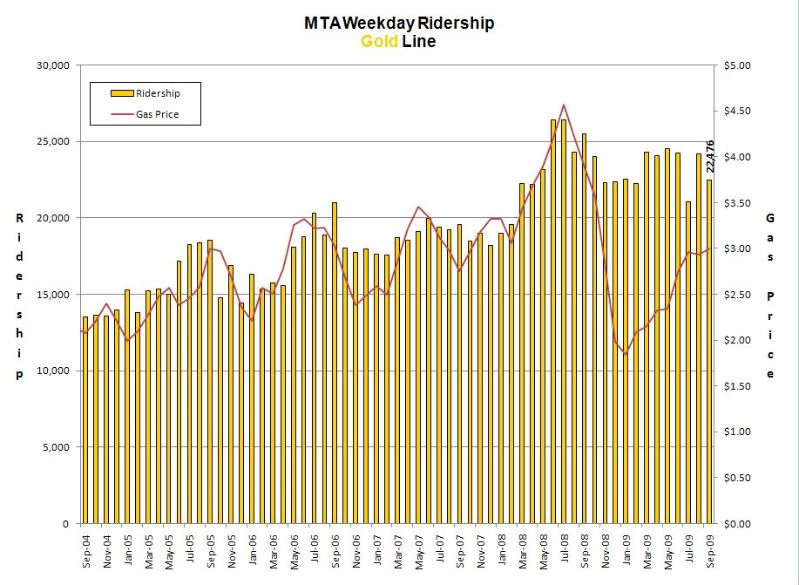 |
|
|
|
Post by rubbertoe on Dec 7, 2009 13:46:01 GMT -8
October numbers are out. Gold Line ridership is down again, as are all the other rail lines. Gas prices continue to drift higher. Not sure if the EE numbers will be reflected in the November numbers or not. Heck, they could even do something kooky like show the EE numbers on their own graph. After all, they did give it a separate name... 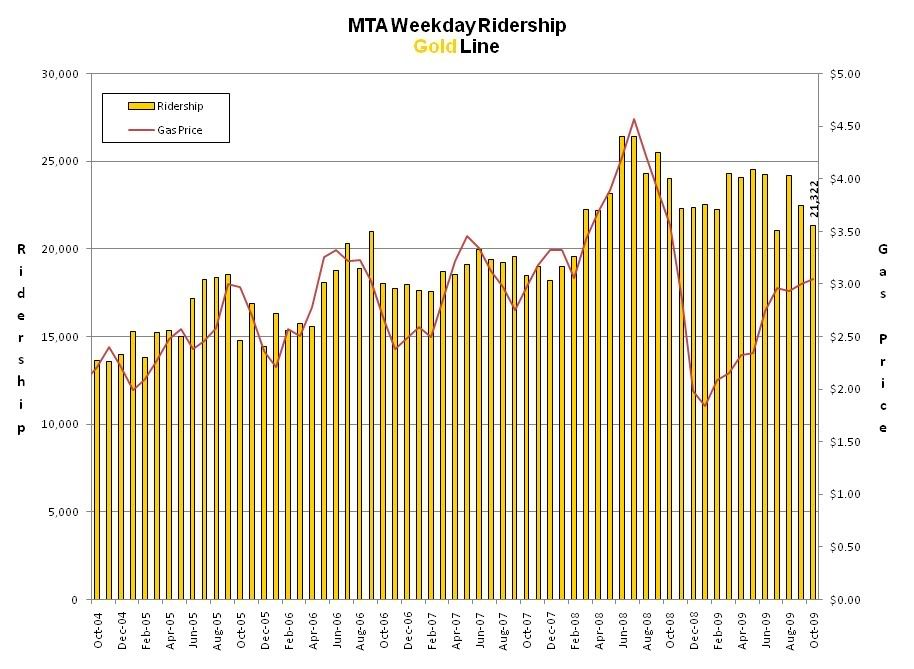 |
|
|
|
Post by spokker on Dec 7, 2009 16:36:21 GMT -8
The unemployment rate is 12.7% in Los Angeles County. I suggest you add it to your graphs. |
|
|
|
Post by bluelineshawn on Dec 7, 2009 19:01:07 GMT -8
The gold line really follows the gas price trend for the most part. The fact that people are out more in the summer shows up in both transit ridership and gas price supply/demand.
|
|
|
|
Post by jeisenbe on Dec 7, 2009 23:47:19 GMT -8
I like Spokker's suggestion; the unemployment rate probably has been keeping ridership abnormally low. If the economy was doing well, these gas prices would have ridership significantly higher. But people just don't have a job to go to.
|
|
|
|
Post by LAofAnaheim on Dec 8, 2009 0:33:59 GMT -8
Economy goes down --> traffic goes down --> parking lot prices go down --> transit ridership goes down
|
|
|
|
Post by rubbertoe on Dec 8, 2009 6:37:01 GMT -8
Spokker,
Great idea, and thanks for the link. LA County unemployment will be added to the graph.
RT
|
|
|
|
Post by metrocenter on Dec 8, 2009 8:52:26 GMT -8
Temperature goes down --> transit ridership goes down.  |
|
|
|
Post by masonite on Dec 8, 2009 16:25:09 GMT -8
The unemployment rate is 12.7% in Los Angeles County. I suggest you add it to your graphs. I don't necessarily see gas prices as a huge indicator of transit use, with the possible exception of longer distance travel among middle class groups (i.e. Metrolink). In a way it is more of a back handed indicator. As the economy roars and people are employed, then oil prices tend to rise. When the economy goes in the tank, oil tends to fall. For someone living in Hollywood and working Downtown, they probably use about 1 gallon of gas round trip if they drove to work. A big rise in oil might make gas about $1 more expensive so that would be an extra dollar for a trip. That might encourage them to use the Red Line somewhat, but I am pretty sure parking prices, traffic patterns, employer incentives for using transit, etc... will make just as much of a difference. Not to mention if this person actually loses his/her job. |
|
|
|
Post by bluelineshawn on Dec 8, 2009 19:09:09 GMT -8
The unemployment rate is 12.7% in Los Angeles County. I suggest you add it to your graphs. I don't necessarily see gas prices as a huge indicator of transit use, with the possible exception of longer distance travel among middle class groups (i.e. Metrolink). In a way it is more of a back handed indicator. As the economy roars and people are employed, then oil prices tend to rise. When the economy goes in the tank, oil tends to fall. For someone living in Hollywood and working Downtown, they probably use about 1 gallon of gas round trip if they drove to work. A big rise in oil might make gas about $1 more expensive so that would be an extra dollar for a trip. That might encourage them to use the Red Line somewhat, but I am pretty sure parking prices, traffic patterns, employer incentives for using transit, etc... will make just as much of a difference. Not to mention if this person actually loses his/her job. I'm pretty sure that you are wrong not only about the relationship between gas prices and transit ridership, but also regarding the relationship between oil prices and the economy. The periodic oil/gas price fluctuations most likely don't have significant effects on ridership, but sudden spikes most assuredly do. Gas went up $2 per gallon from 2007 to 2008 and half that came in just a few months. The large increase in ridership had everything to do with that and nothing to do with the economy which was definitely not booming. And if anything the price of oil counter intuitively falls during good times and rises during bad times. Perhaps the price of oil in large part determines whether times are good or bad? |
|
|
|
Post by masonite on Dec 8, 2009 22:56:36 GMT -8
I don't necessarily see gas prices as a huge indicator of transit use, with the possible exception of longer distance travel among middle class groups (i.e. Metrolink). In a way it is more of a back handed indicator. As the economy roars and people are employed, then oil prices tend to rise. When the economy goes in the tank, oil tends to fall. For someone living in Hollywood and working Downtown, they probably use about 1 gallon of gas round trip if they drove to work. A big rise in oil might make gas about $1 more expensive so that would be an extra dollar for a trip. That might encourage them to use the Red Line somewhat, but I am pretty sure parking prices, traffic patterns, employer incentives for using transit, etc... will make just as much of a difference. Not to mention if this person actually loses his/her job. I'm pretty sure that you are wrong not only about the relationship between gas prices and transit ridership, but also regarding the relationship between oil prices and the economy. The periodic oil/gas price fluctuations most likely don't have significant effects on ridership, but sudden spikes most assuredly do. Gas went up $2 per gallon from 2007 to 2008 and half that came in just a few months. The large increase in ridership had everything to do with that and nothing to do with the economy which was definitely not booming. And if anything the price of oil counter intuitively falls during good times and rises during bad times. Perhaps the price of oil in large part determines whether times are good or bad? If gas prices are the primary indicator, how come May 09's Red Line ridership is higher than May 08's even though gas prices were more than $1.50 a gallon lower? Actually, since unemployment was rising during that time, I think that one is a tough to comprehend, but if all the rise during 08 was due to higher gas prices as you say, how come it increased even more in 09 with sharply reduced and rapidly declining gas prices? I'm not saying gas prices don't have anything to do with ridership, I just think the relationship is vastly overstated by some. |
|
|
|
Post by kenalpern on Dec 9, 2009 6:33:23 GMT -8
I concur with masonite--gas prices are AN indicator, but not THE indicator of ridership any more than it is for automobile traffic. In the end, it's a multifactorial situation with the economy, trip generators, etc.
|
|
|
|
Post by bluelineshawn on Dec 9, 2009 7:15:12 GMT -8
I concur with masonite--gas prices are AN indicator, but not THE indicator of ridership any more than it is for automobile traffic. In the end, it's a multifactorial situation with the economy, trip generators, etc. I think that everyone agrees with that. To my knowledge no one here (or anywhere) has ever suggested that gas prices were the only indicator or even the most important indicator. But it is an easy indicator to put on a graph and notice trends. As I said before, sharp increases in gas prices do temporarily effect transit ridership. The graphs show that to be more than anecdotal. |
|
|
|
Post by bluelineshawn on Dec 9, 2009 7:27:47 GMT -8
If gas prices are the primary indicator, how come May 09's Red Line ridership is higher than May 08's even though gas prices were more than $1.50 a gallon lower? Actually, since unemployment was rising during that time, I think that one is a tough to comprehend, but if all the rise during 08 was due to higher gas prices as you say, how come it increased even more in 09 with sharply reduced and rapidly declining gas prices? I'm not saying gas prices don't have anything to do with ridership, I just think the relationship is vastly overstated by some. No on has said that gas price is the primary indicator, but in certain situations it does have a significant effect and we can see that when it's plotted on a graph. As I said when gas prices spike, there is a temporary spike in transit ridership. The many other indicators/factors that go into transit ridership are more important to the big picture, but maybe can't be graphed as easily. How do you graph "the economy"? And is an improving economy seen immediately in ridership or does it lag? He doesn't have gas prices on the graph so much to explain ridership, I don't think. It's just an interesting indicator where sometimes the effect is readily apparent. Sometimes the trends can be misleading. Like rising gas prices every summer. Transit ridership is up because travel in general is up. Not because of gas although the trend makes it seem that way. You have to take the graph FWIW. I like it. |
|