|
|
Post by rubbertoe on Oct 18, 2010 6:48:45 GMT -8
I'll post this 5 year graph quarterly, starting with the current September 2010 numbers. This actually shows ridership since service inception. 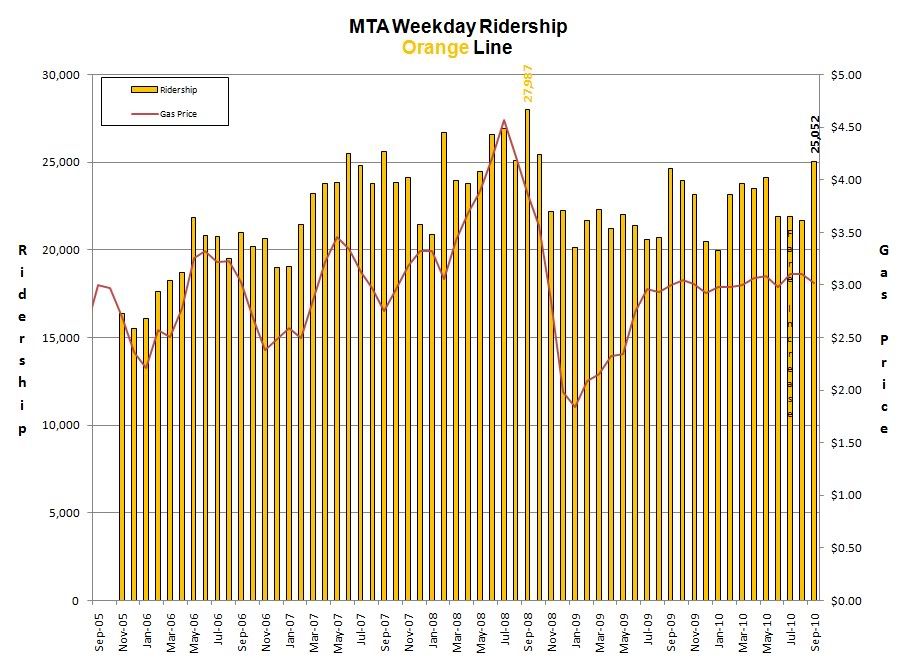 |
|
|
|
Post by jamesinclair on Oct 18, 2010 13:42:19 GMT -8
Its interesting how this line appears to have the most volatile ridership. The September jump seems to have also happened last year for some reason.
|
|
|
|
Post by rubbertoe on Oct 18, 2010 14:53:21 GMT -8
Its interesting how this line appears to have the most volatile ridership. The September jump seems to have also happened last year for some reason. The September jump happens "every" year, for 5 years in a row. It could be coincidental, but 5 years running makes me think there is some underlying reason. Only thing that comes to mind is school  Not sure why that would be though. And none of the other rail lines bumps up every September line the Orange Line does... RT |
|
|
|
Post by tonyw79sfv on Oct 29, 2010 5:54:04 GMT -8
Today (29 October 2010) marks the 5th anniversary of the Orange Lines debut. It seems that as the graphs has shown, the line is a solid performer averaging 25k boardings. Now only if it was light rail so those ridership numbers could be factored into the systemwide Metro Rail numbers.
|
|
|
|
Post by matthewb on Nov 8, 2010 13:05:50 GMT -8
If only it were light rail, it would have even higher ridership.
|
|
|
|
Post by rubbertoe on Jan 25, 2011 8:39:46 GMT -8
The end of year 2010 December numbers. The 23,957 is 17% better than 2009, and 7% better than the 22,255 from 2008. A slight uptrend is visible from the bottom in January 2009. And yes, that September spike definitely jumps off the page. We are about 18 months away from the Chatsworth 4 mile extension opening. 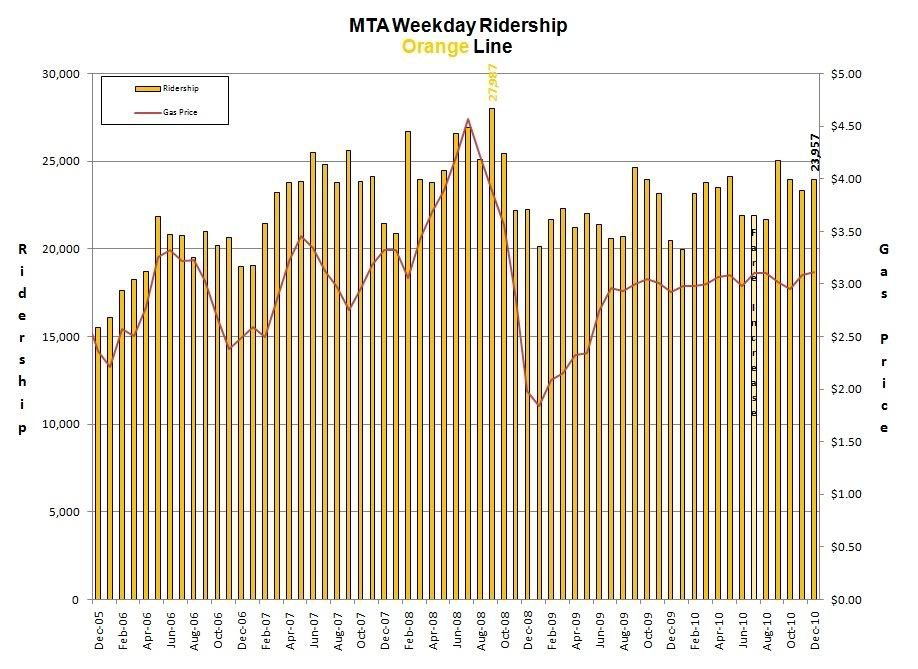 |
|
|
|
Post by jamesinclair on Jan 25, 2011 16:11:12 GMT -8
Orange seems to have the clearest relationship to gas prices.
What does the extension predict to have in ridership? Also, has this line met ridership goals?
|
|
|
|
Post by bzcat on Jan 25, 2011 18:22:57 GMT -8
I believe the Orange line has surpassed its original (very modest) ridership estimate since day 1.
|
|
|
|
Post by jeisenbe on Jan 27, 2011 0:07:40 GMT -8
|
|
|
|
Post by metrocenter on Jan 27, 2011 8:55:21 GMT -8
Well according to the ridership graph, the Orange Line has been in the 21-25 k range most of the time since 2007. Talk about exceeding expectations!  |
|
|
|
Post by rubbertoe on Apr 13, 2011 8:02:24 GMT -8
March 2011 numbers: 24,965 Have to agree with the previous poster about the Orange Line tracking gas prices better. Typically do not get over the 25,000 hurdle until summer, but we almost got there this March. YOY the March increase was 1,155 or 4.85%. 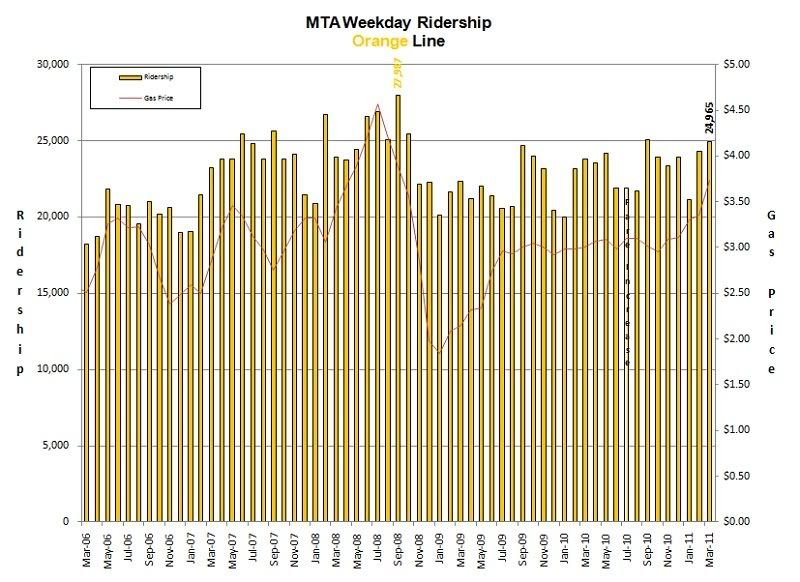 |
|
|
|
Post by jamesinclair on Apr 13, 2011 13:02:04 GMT -8
We might see a new orange line ridership record this summer.
Has metro added buses for demand?
|
|
|
|
Post by rubbertoe on Jul 13, 2011 17:03:34 GMT -8
June 2011 numbers: 22,668 A bit disappointing. While it is up 789 YOY, it is the only line to show a dropoff from the previous month, though the Orange Line tends to do that in June. In looking at the raw data, I see that 16 of the last 17 months show positive YOY increases. Unlike the Red Line, the Orange Line didn't seem to hold it's riders when gas prices fell. Maybe the recent rise in gas is also contributing to the 16 of 17 I mentioned. 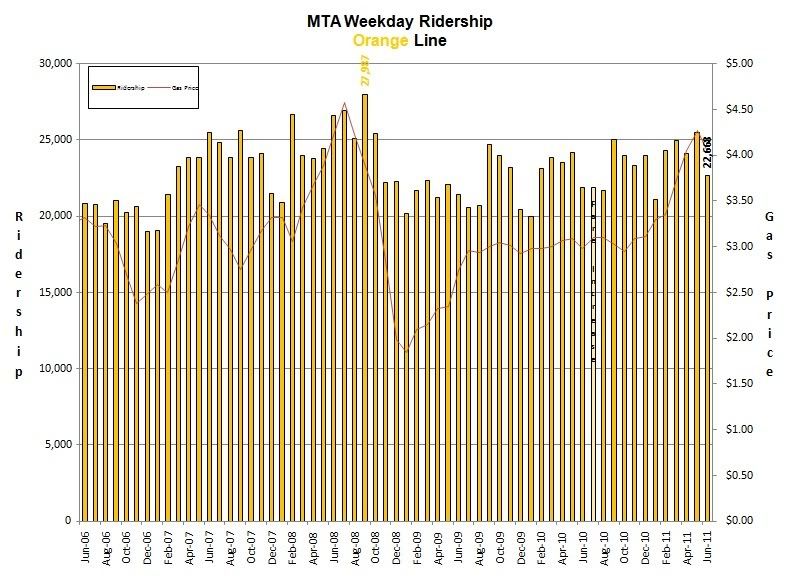 |
|
dane
Junior Member

Posts: 59
|
Post by dane on Jul 14, 2011 15:14:02 GMT -8
Could the dropoff in June be attributable to a significant amount of student riders from Valley College and Pierce College? Other than late 2008-early 2009, the ridership does seem to mirror gas prices, so maybe cheap gas wins out.
|
|
|
|
Post by rubbertoe on Oct 13, 2011 6:13:49 GMT -8
September 2011 numbers: 26,883 We see the usual September peaking of the Orange Line. 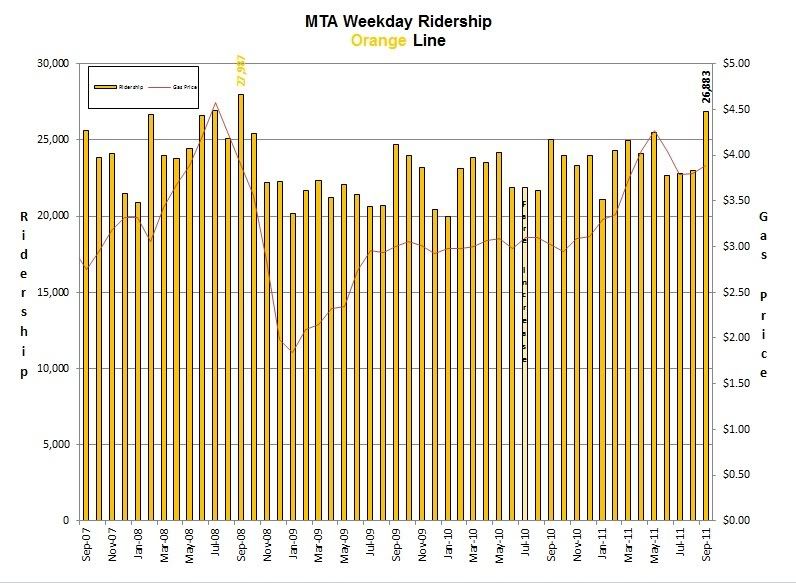 |
|
|
|
Post by jamesinclair on Oct 13, 2011 16:24:48 GMT -8
Its interesting that all the other lines peak in July, but the Orange peaks in September.
|
|
|
|
Post by rubbertoe on Jan 19, 2012 8:40:09 GMT -8
December 2011 numbers: 22,462 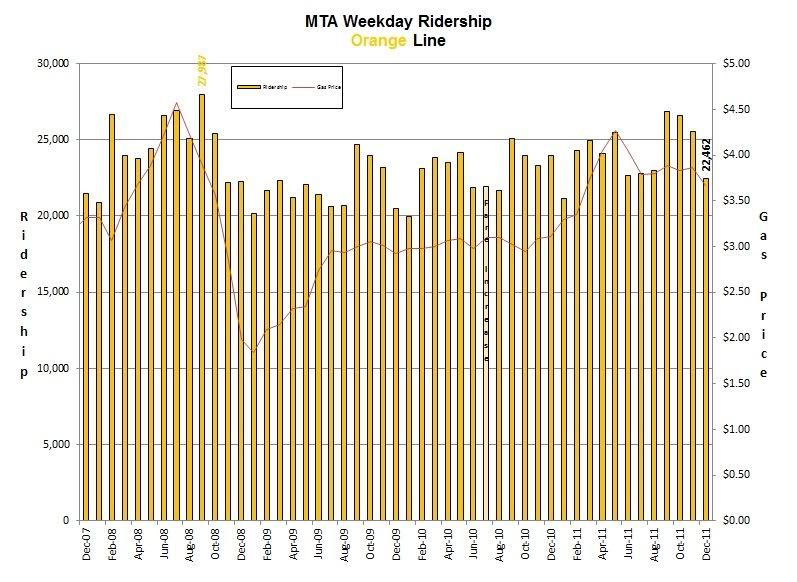 The Orange line actually had a very nice quarter. 2011 versus 2010 average is 24,867 versus 23,752. RT |
|
|
|
Post by rubbertoe on Apr 26, 2012 7:16:29 GMT -8
March 2012 update: 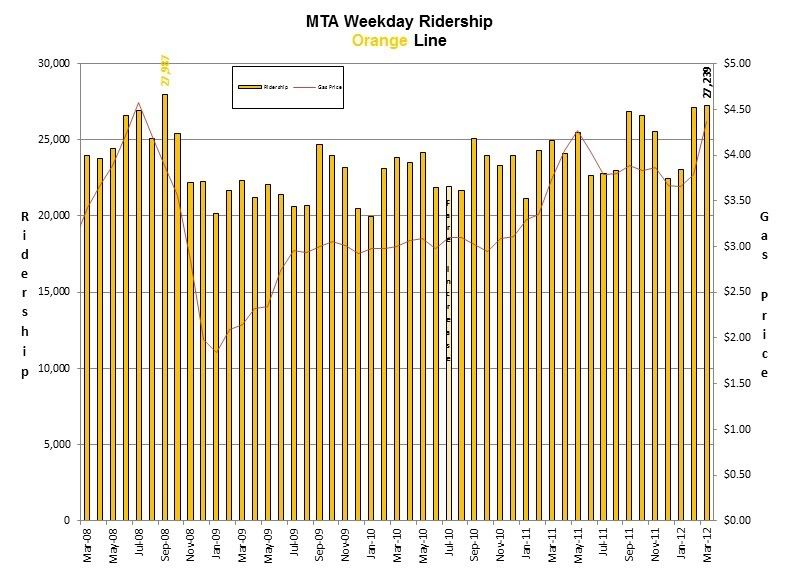 A very good quarter for the Orange Line. The September 2008 high was almost beat in both February and March of this year. The summer should see all time high(s). Looking back at the previous years, there is often a large gap up from January, so this trend is not unique, but the total riders is higher. RT |
|
|
|
Post by macross287 on Apr 26, 2012 13:28:15 GMT -8
The February and September jumps in the Orange line ridership correlate really well with the start of classes on LA community college calender. I take it more students and faculty are using the Orange line to get to Valley and Pierce Colleges.
Now if Metro could only put 80 ft buses on the line and maybe install some quad gates at the smaller intersections.
|
|
|
|
Post by rubbertoe on Jul 31, 2012 11:51:01 GMT -8
June 2012 update: 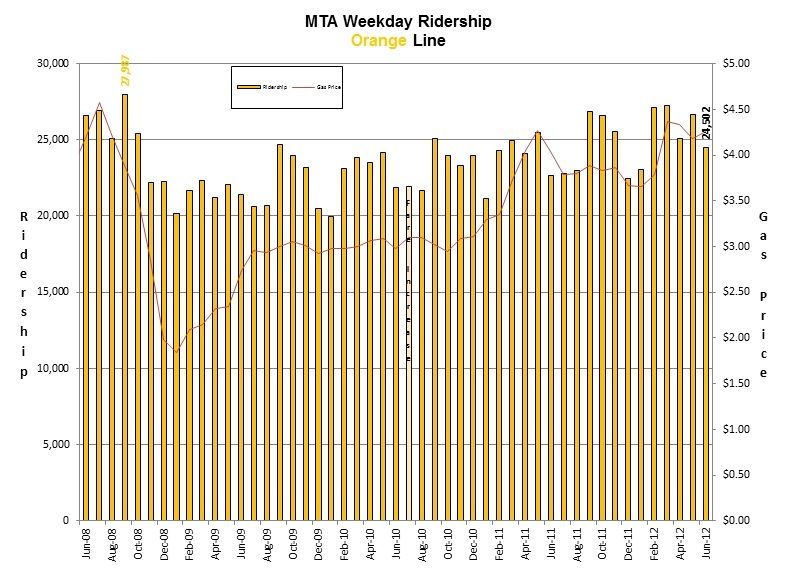 Quarterly average of 25,409 versus the 2011 Q2 average of 24,076. Next quarter we will start to see the effect of the opening of the new Chatsworth extension. I'll update the graph then to show that in July 2012. RT |
|
outthere15
New Member
Take back the rails
Posts: 33
|
Post by outthere15 on Nov 3, 2012 19:39:22 GMT -8
So did we see a ridership bump when the Chatsworth station opened?
|
|
|
|
Post by rubbertoe on Nov 5, 2012 8:37:10 GMT -8
So did we see a ridership bump when the Chatsworth station opened? I haven't posted the September graph yet, but here is the raw data: July: 26,087 August: 27,513 September: 31,787 That 31,787 is the all time high. RT |
|
|
|
Post by masonite on Nov 5, 2012 9:05:27 GMT -8
So did we see a ridership bump when the Chatsworth station opened? I haven't posted the September graph yet, but here is the raw data: July: 26,087 August: 27,513 September: 31,787 That 31,787 is the all time high. RT It seems to be performing at about what was roughly expected - an additional 4k riders. |
|
|
|
Post by rubbertoe on Nov 28, 2012 5:58:05 GMT -8
September 2012 numbers: 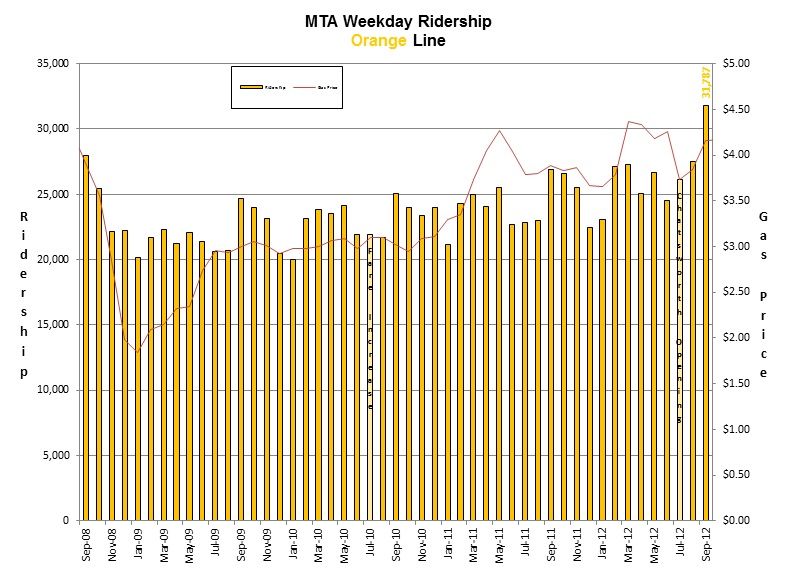 The September ridership of 31,787 is the obvious new all time high. Compared to the year earlier level of 26,883 it looks like the Chatsworth extension added about 5k riders. The high jump from August to September is normal. The quarterly average was 28,462 compared to a year ago level of 24,226 so thats a little over 4k gain. It may take several months before the area residents get familiar with the extension and the ridership gains stabilize. RT |
|
|
|
Post by macross287 on Nov 29, 2012 21:49:45 GMT -8
The FEIR estimates the Chatsworth extension to add 9,000 new riders and a total of 45,000 boardings along the whole alignment by 2030. It will be interesting to see how quickly the ridership on the Orange line approaches those numbers and how metro operations will attempt to handle that many riders when it does happen.
|
|
outthere15
New Member
Take back the rails
Posts: 33
|
Post by outthere15 on Dec 2, 2012 17:37:20 GMT -8
If and when the subway from the west side (LAX - Sylamar) reaches the Orange Line, this line will be beyond maxed out and will probably have to become a light rail line
|
|
|
|
Post by LAofAnaheim on Dec 2, 2012 19:37:32 GMT -8
If and when the subway from the west side (LAX - Sylamar) reaches the Orange Line, this line will be beyond maxed out and will probably have to become a light rail line Unless the Valley repeals the Robbins Bill, can the Orange Line be converted to rail? |
|
|
|
Post by jdrcrasher on Dec 2, 2012 20:37:29 GMT -8
If and when the subway from the west side (LAX - Sylamar) reaches the Orange Line, this line will be beyond maxed out and will probably have to become a light rail line Upgrading to light rail is built, especially if plans to extend it to Burbank and beyond are to move forward. Another thing that will help, though, is starting to focus on building a parallel light rail on Ventura Blvd. Have it start on Olive at burbank metrolink, cross the LA river with a transfer station at Universal City, run on Ventura Blvd, jump on Reseda and head towards CSU Northridge. basically a really long U-shaped route. Heh, we can then call it the "Universal line". |
|
|
|
Post by rubbertoe on May 20, 2013 14:23:40 GMT -8
March 2013 numbers: 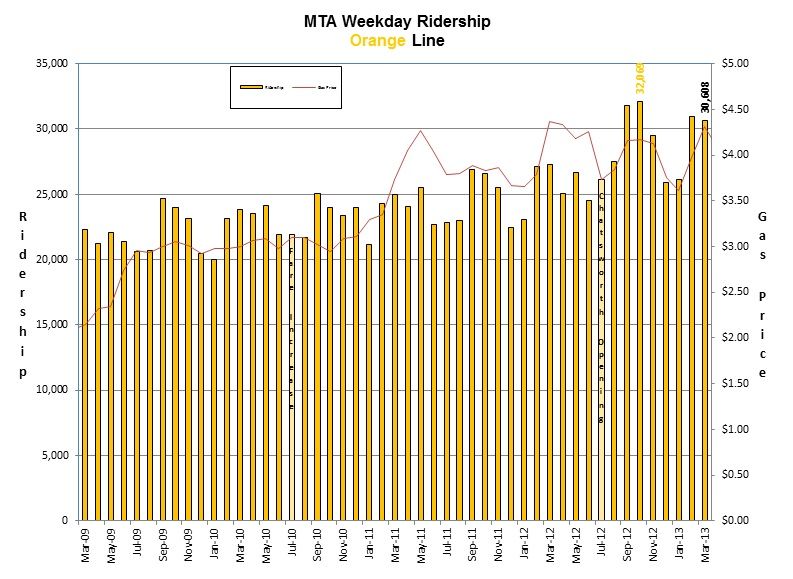 The last quarter of 2012 and the first quarter of 2013 both show the Chatsworth addition from the previous years numbers. December 2012 quarter averaged 29,140 versus a year earlier 24,867. And the first quarter of 2013 showed an average of 29,243 versus 25,798. About 3-4k more daily riders now. RT |
|

 Not sure why that would be though. And none of the other rail lines bumps up every September line the Orange Line does...


